Rail Intermodal “Booming”
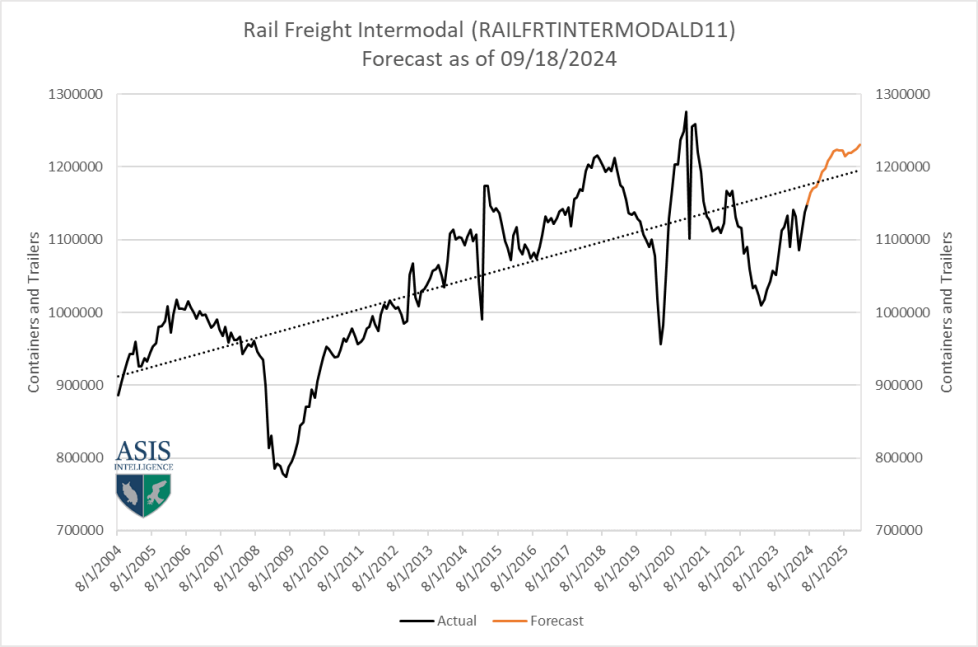
One of the positive signs from the economy is coming from the intermodal sector. The National Retail Federation is still predicting an average of 2 million containers (40-foot equivalent units) a month through November, and then it will trail off just slightly into December.
The Flash Report for the intermodal model is shown at right. This model is currently batting at about 96.9% accuracy six months in advance and 95.6% three months out.
If this model pans out as it currently sits, it will come in with growth of 5.35% through the end of the year. The Association of American Railroads is showing current YTD growth of nearly 10%. It looks like a good growth trend for inbound containers (which also then translates into stronger trucking volumes and tonnage.

Recently, the inventory to sales ratio imbalance was largely at work in the intermodal and broader freight industry. Inventory overstocks led to a big portion of the supply chain shutting off. That shut off created enough of a deceleration in freight activity that it created a secular recession. These cycles typically last about 18 months historically, and this one is nearly 24 months old.
But the inventory to sales ratio is largely back in cycle across many industries – this is the catalyst that helpsboost both intermodal volumes and trucking tonnage. These models incorporate 18-22 different economic metrics and a proprietary approach to
New economic data is plugged in as it is released each month, and that in turn affects the forecast – which is adjusted every month. In the latest adjustment, none of the models are showing recession risk at this time, and the intermodal model certainly doesn’t have that risk in the forecast. Again, that could change, but that’s the view for now.
Jobs Report Details
As mentioned earlier, this was a blowout jobs report and well above expectations. There has been a great deal of buzz about the validity of data heading into the election. But frankly, most of these agencies are being run by legacy officers that have been in place for decades, across multiple administrations. This doesn’t mean that the data won’t be revised later, but the revisions that came in this report pushed both July and August job creation even higher. So, it is what it is.
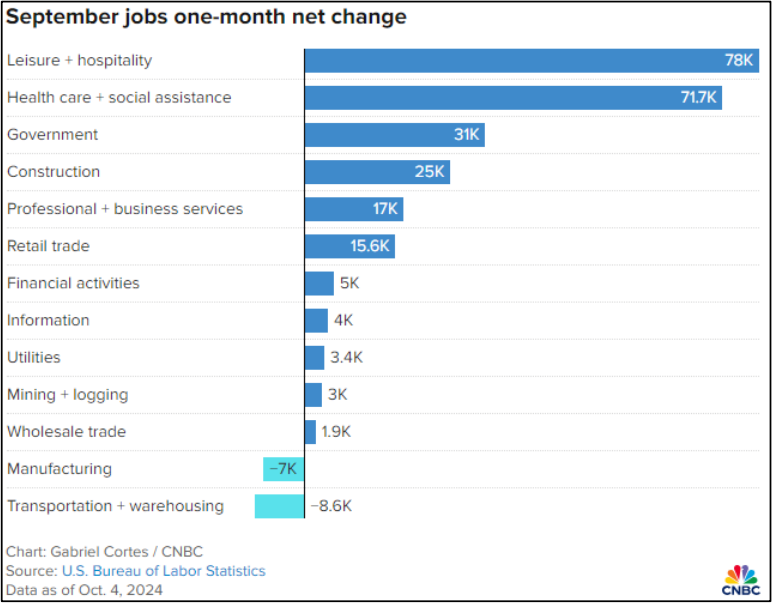
There are thousands of different cuts and slices of data, but a simple look at jobs created by sector seems to be most effective. The chart below is from CNBC.
The leisure/hospitality sector is the biggest gainer followed by healthcare. The government still made up 31K of the 254K jobs added this month.
There are a couple of key areas to watch. Unemployment rates are the first. At 4.1%, the U-3 rate was unchanged. The broader U-6 rate can really help everyone understand the health of the consumer.
This month’s U-6 rate came in at 7.7%, down from 7.9% last month but 10.0% higher year-over-year against September of 2023. Now, the news is still not bad; 10% rate increase yearover-year is down from 11.3% last month and a revised 16.4% two months ago. So, it’s a good news / bad news scenario.
The other factor that bears watching is the wage growth rate. Average hourly wages are growing at a 4% annual rate, which is well ahead of the 2.7% inflation rate recently posted. This relationship between wage growth and inflation is a critical viewpoint for the Fed. As long as wages are still growing at a faster rate than core inflation, households have the wherewithal to dig out of financial challenges.
This economy is in a rare growth mode, a K-shaped recovery in which a portion of the economy is doing well, while another segment continues to recover. Many will comment that this is a normal relationship in a free market economy, but the gap between the various sectors that have done well versus those that are struggling is more dramatic in a K-shaped recovery. It is this upper end of the K (roughly, households making more than $75K a year with some modest investments) that continues to drive the economy and consumer spending. For now, with this labor data in hand, it looks like those households will continue to get stronger in the near term, and even the bottom end of the K is finding the resources to begin some modest recovery. Lastly, this will help with discretionary spending categories – and really help boost spending heading into the holiday shopping season.
A Tale of Two Consumers
You can tell a lot about the differences between nations by looking at their consumers and their saving and spending habits. The US consumer has continued on a spending binge regardless of pesky inflation (or maybe because of it). The savings rate is lower than it was prior to the pandemic at 5.2% (lower than the 6.1% rate from 2010 to 2019). Meanwhile, in Europe the rate of savings has hit new highs at 15.7%. That is the highest level in three years and is above the 12.7% rate that existed prior to the pandemic. Americans are still reveling in the post pandemic freedom to spend, but European consumers are expecting a more severe recession and have been saving in anticipation. Most of the consumer activity in the US has been driven by the upper third of income earners, obscuring the fact that lower income earners have essentially checked out as 90% are living paycheck to paycheck. These consumption numbers have also affected job growth.
The more than unexpected job numbers reveal a lot about the state of the economy as well as overall consumer mood. The majority of that job expansion was in the service sector, and that is also where most of the spending has been taking place. The upper income consumer is far more oriented towards travel, entertainment, and paying people to do the things they no longer want to do (such as mowing the lawn and shoveling snow).


