Diving Into the May Jobs Report
There was (once again) a little something for everyone in the May jobs report. This article will present the data and try to put it in the correct perspective. After analysis, one can conclude that 1) the labor market remains tight, 2) wages are still growing at a rate that makes it tough for businesses to keep pace, and 3) there are some hints of some softening in a few areas.
- Wage growth moved up, from an annual rate of 3.9% to 4.1%, which shows there is no cooling in wage inflation at this point. The flip side is that wage growth is strong, and that will help keep many consumers in a strong position for spending, especially in households above $75,000 a year in income.
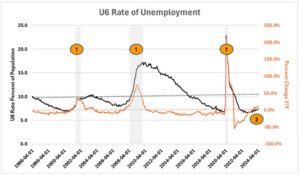
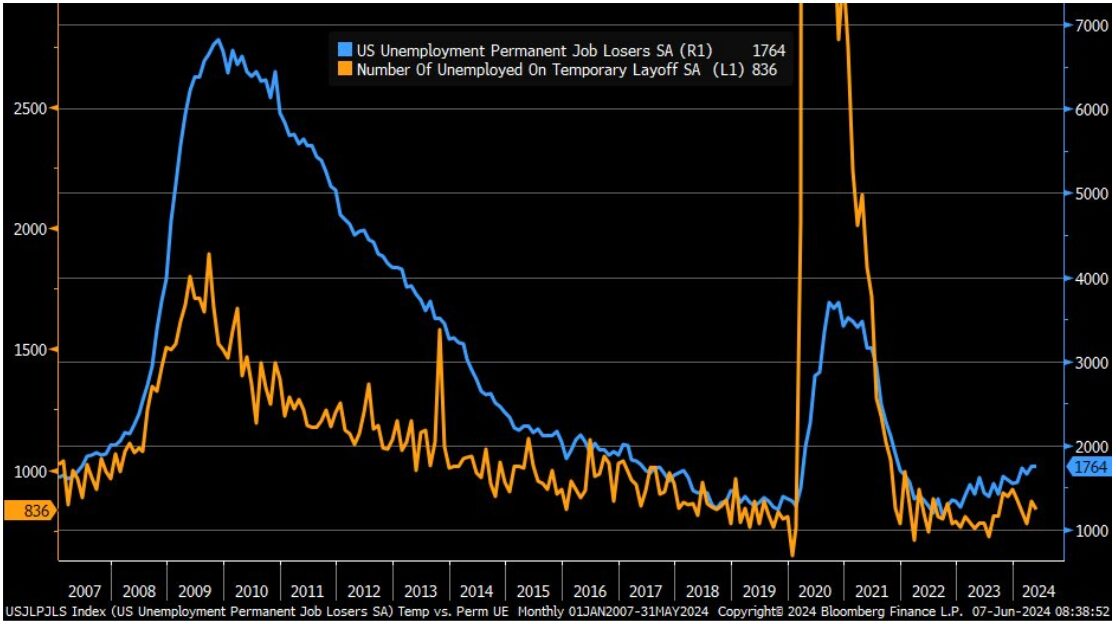
- Official data on layoff activity shows an increase (blue line above), and levels are now above the 2018- 2019 averages, but overall, the rate remains historically low.
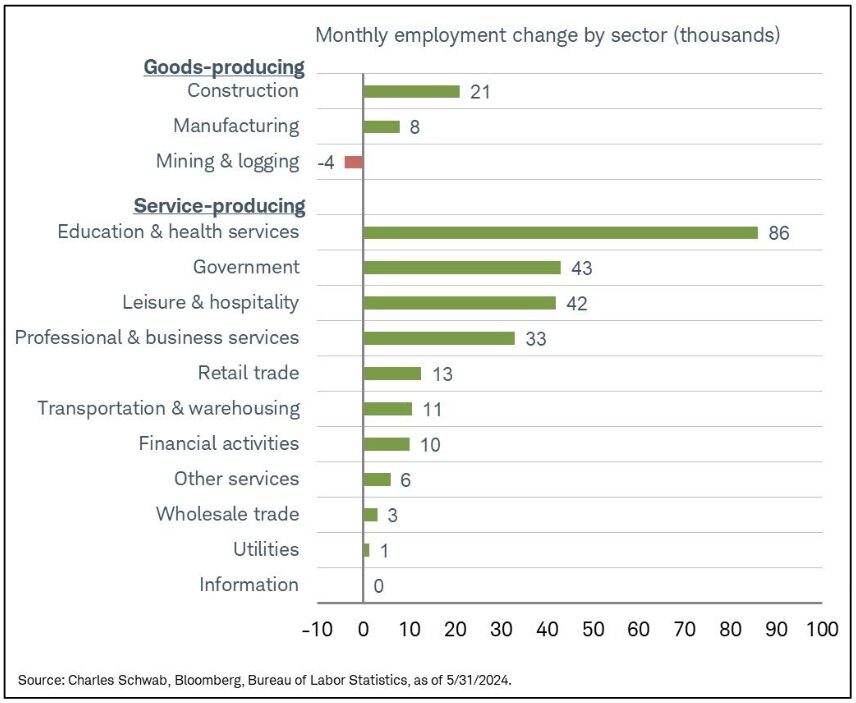
- Private sector job growth is still steady on a year-over-year percent change basis. Breaking down growth by sector, one can see that education and health services added the most jobs in May at 86,000. Government hiring was second highest at 43,000, while leisure and hospitality (for summer travel season) added 42,000.
- Professional and business services came in with a respectable extra 33,000 jobs.
- Other sectors that showed growth were construction (21,000), retail (13,000), transportation and warehousing (11,000), financial activities (10,000) and manufacturing (8,000).
- The others were within rounding errors and were essentially flat.
- Mining and logging were down 4,000 jobs.
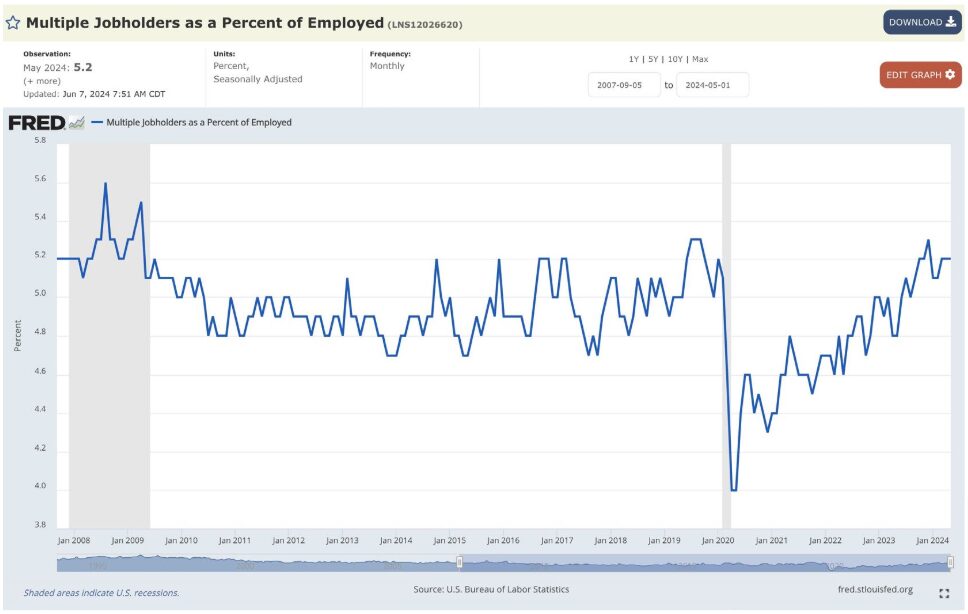
- The number of people working multiple jobs hit 8.4 million in May, which is 3 million higher than levels in 2020. One analyst felt this was misleading because the rate is 5.2%, which is “normal.” Well, it isn’t normal; this is at a level that would rival the highest peaks in the decade prior to the pandemic and just 2-tenths of a percent from Great Recession levels. It should be in the 4.9% 2010-2019 average range. So again, the rate is alarming and suggests that people are being forced to work multiple jobs to cover inflationary impacts.
- Part-time employment increased by 286,000 in May, but full-time employment fell by 625,000 (biggest drop since December of 2023). The reason for the difference between this and the total 272,000 jobs created this month is the differences in the household (surveys of households) and establishment data (establishment is generated from reports by businesses).
- Again, concerns over data collection techniques are weighing on the data. The non-farm payroll numbers have been adjusted downward in 13 of the last 14 months – the BLS just can’t seem to get accurate first-time readings.
Risk Mapping Supply Chains
Over the last several years, the state of the global supply chain has been front and center for almost every business. There are national security concerns, and there are worries over the kind of disruptions that have become all too common (Pandemic impact, Panama Canal drought, Red Sea attacks, etc.). The US is now actively mapping supply chain risk in a way that a business can access. The system allows a company to essentially score the risks of a given supply chain so they can decide on where to source. It is not perfect, as the data available is not updated as often as would be preferred, but it is a start. The data shows that roughly a third of all the imports of key electronics into the US come from “friendly” nations. The areas of greatest vulnerability are pharmaceuticals, computer chips, and critical minerals. Many of the imports of these items come from nations unfriendly to the US or nations that are threatened (such as Taiwan).