Global Manufacturing PMIs Come in Mixed in February
Many of you have heard that the services sector accounts for roughly 60% of the US economy, but that isn’t the full truth. There are sectors in the economy such as retail that couldn’t exist without products to move, despite being categorized generally as a services category. In reality, industries that handle, produce, and consume products account for more than 70% of the global economy
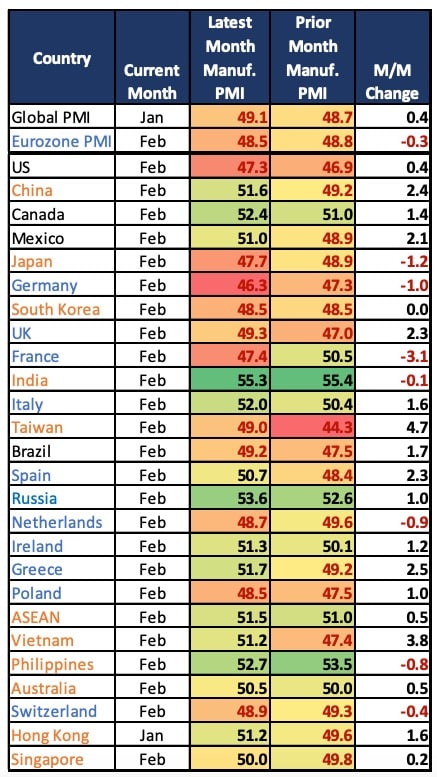
Although more reports have yet to be released, the report to the right was interesting and gives a different outlook on the global economy. Here are some of the highlights:
1. The US improved slightly to 47.3; the direction of the trend was positive as it showed some improvement in activity, but it remained in contraction.
- New orders were still weak.
- But inventories were becoming balanced.
- Supply chains and deliveries from suppliers were improving.
- Backlogs were also being cleared.
2. Mexico bounced back into expansion, and Canada remained strong. Both were reporting that manufacturers were clearing backlogs but that new order demand was more sluggish. That could spell trouble for both countries if new order demand doesn’t pick up more quickly.
3. Global reports showed that backlogs were clearing across the board because supply chains were more fluid and bottlenecks and delays in transportation were almost non-existent.
4. This improvement in supply chain fluidity has helped boost manufacturing sentiment. Many manufacturers are now expecting the rest of the year to slowly build momentum throughout.
5. Input costs remained higher, and some manufacturers were discounting their products to try to build new sales, reduce inventory, and hang on to talent that they have worked hard to recruit.
6. Globally, Europe is still seeing some difficulties except in the UK, Spain, and Ireland. Other countries were reporting a drop in new export orders.
7. China saw acceleration in both domestic and international markets. Inventories were lower for Chinese manufacturers, and input costs were rising as a mild scramble for raw materials takes place.
8. Other areas of Asia were still weaker, except in Vietnam which seems to be benefitting from supply chain sourcing shifts away from China. India was also still strong.
Overall, this was an interesting report, and many aspects of it lifted optimism that the global economy could recover a bit more quickly than thought. Europe coming out from under energy challenges this winter has helped to lift the industrial complex, and China’s coming out after lifting their zero-Covid policy is showing that the Chinese economy is starting to build momentum. Just the stockpiling of resources taking place in China is evidence that they are expecting strong growth ahead (whether due to military actions or simply sustaining an emerging Chinese consumer). In either event, the global environment could be changing.
Global Supply Chain Pressures Index Inverts
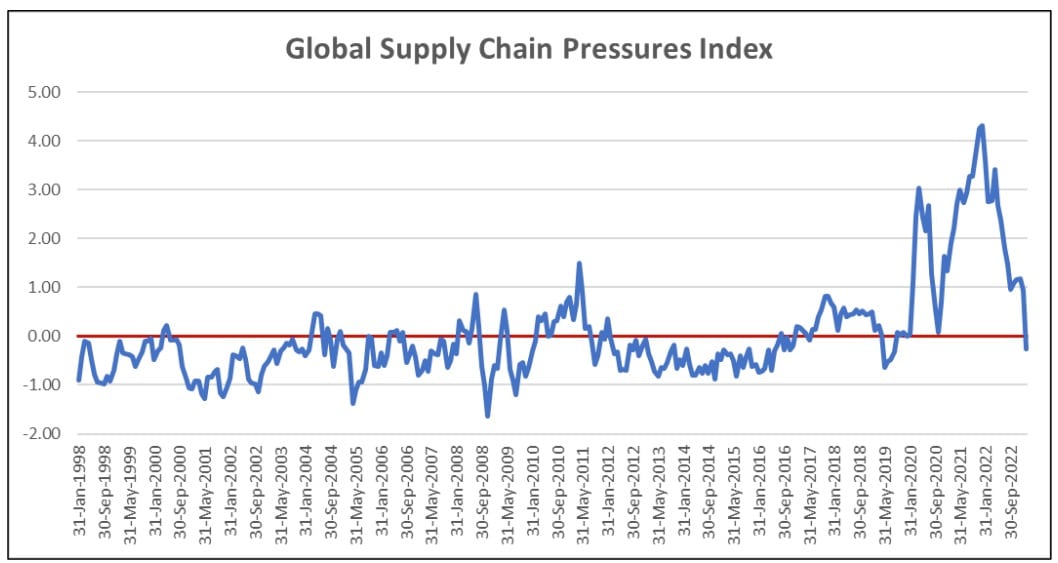
The New York Fed’s Global Supply Chain Index has just inverted in February to -.26. What this means is that the pressure on supply chain managers has eased enough now that the market is fairly “balanced.” Congestion, bottlenecks, delays, high prices, etc. should be improving, according to the report.
This measure watches more than 20 global supply chain measures, and it aggregates the standard deviation away from the norm. The higher the index, the more the deviation and the greater the degree to which the industry has strayed from normal. So in this case, conditions are essentially balanced, a welcome sign for those managing global supply chains.
There are a few items to watch in the upcoming months. There is some improvement in the Baltic Dry Index, and some global raw materials are starting to feel some pressure. Inventories of some raw materials are weaker (at the same time that demand is starting to rise in parts of Europe and Asia). That could start to push some shortage measures higher and increase volatility in the index again.
If the index continues to fall, one must look at what that will mean for global recession risk. For now, seeing supply chains getting back in cycle will help many industries that have been plagued with product shortages (automotive, aerospace, machinery, electrical products, etc.).
Not Sure How Food Prices are Coming Down
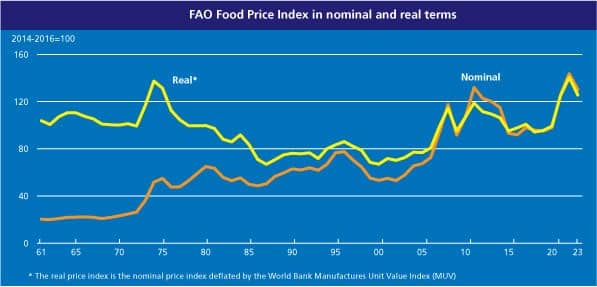
When looking at the UN’s World Food Programme Food Price Index, it is tough to understand fully how it can be dropping when global supply is weaker (at least with Ukraine and Russian production weaker than it has been historically) and the fact that there is significant starvation taking place throughout Africa. But, if one accepted the data earlier last year when it hit new all-lows, one has to accept the fact that prices are now falling.
The chart (above) from the UN shows the index overall, the yellow line being inflation-adjusted food prices. They have remained higher than average since the 1973 period, and perhaps that’s the key point here. But they are notably dropping, despite demand worldwide being among the highest ever (with tremendous aid needed across Africa and parts of the Middle East.
Other spot food shortages are pushing prices higher (such as the price for eggs) across the US. But on a broader basis, food prices are coming down. They just haven’t been dropping quickly.
There are still many questions about the global food production situation. A cool winter could theoretically help with more output, but that will be offset by continuing challenges with production in Ukraine and Russia which combined accounted for nearly 30% of the world’s grain exports.
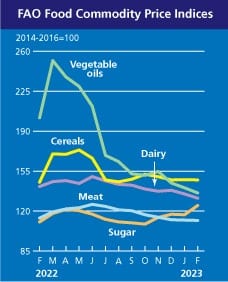
The chart at right shows the various commodities in the food index, and most of them are lower. Sugar prices are still elevated, and cereals are also flattening. But the drop in meat, dairy, and vegetable oils is significant.
With transportation prices falling, diesel moderating, and other inflationary measures easing slightly, there is hope that aid for some of the worst-hit regions of the world will start to increase.
